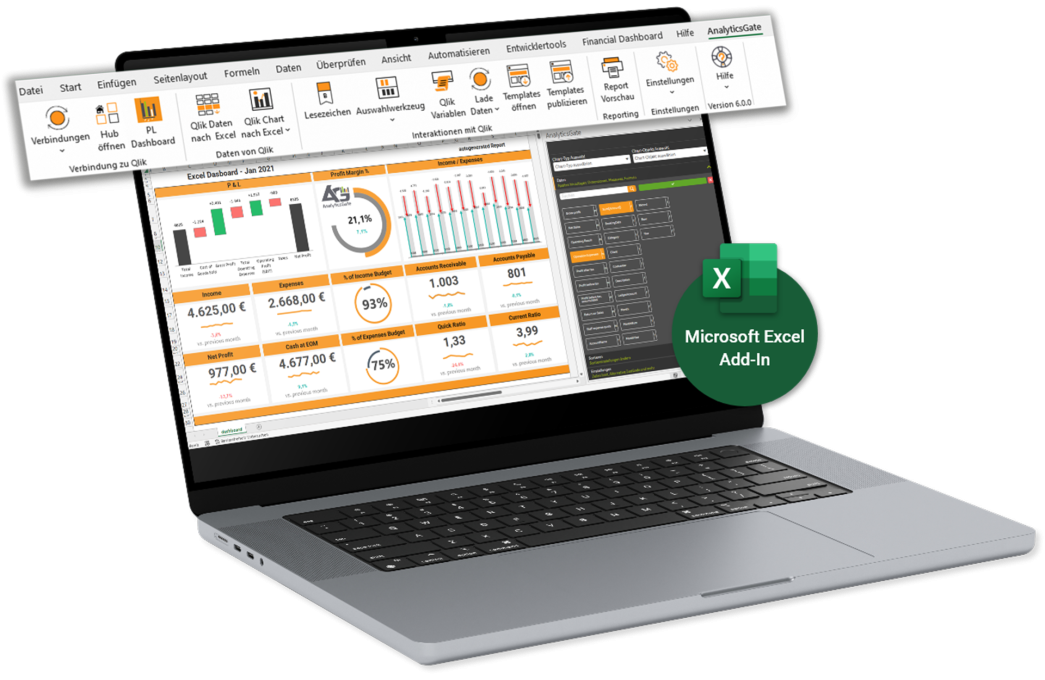
Professionelles Reporting
AnalyticsGate vereinfacht das Erstellen von Reports, indem es eine benutzerfreundliche und intuitiv zu bedienende Plattform bietet.
Intuitive Bedienbarkeit
Das Add-in ist einfach zu bedienen und erfordert keine Vorkenntnisse in Programmierung oder statistischen Methoden.
Erweiterte Analysen
AnalyticsGate bietet eine Vielzahl von Analysefunktionen, die über das Standardangebot von Excel hinausgehen und eine tiefere Einsicht in die Daten ermöglichen.
Revolution der Datenanalyse mit AnalyticsGate
AnalyticsGate ist mehr als eine Plattform für Web-Analyse. Es ist eine Lösung, die dir hilft, fundierte Entscheidungen für dein Unternehmen zu treffen und das volle Potenzial deiner Daten zu nutzen. Mach dich frei von der Frustration und Unsicherheit durch veraltete Reporting-Tools und steige auf eine neue Ära der Datenanalyse um!
Vor der Nutzung von AnalyticsGate
- Frustration und Unsicherheit durch fehlende verlässliche Kennzahlen in allen Ebenen des Unternehmens
- Bunte Dashboards ersetzen nicht die Klarheit und Effektivität von tabellenbasierten Kalkulationen
- Excel-Exporte sind eine Einbahnstraße, die das volle Potenzial der Datenanalyse verhindern
- Manuelle Berichterstellung ist mühsam und zeitaufwendig
Mit AnalyticsGate
- Keine Frustration mehr! Endlich arbeiten alle mit einer verlässlichen Single Point of Truth für alle Daten
- Behalte das gewohnte Excel-Umfeld und steigere gleichzeitig die Effektivität deiner Datenanalyse
- Analysiere, filtere und erweitere deine Daten auf neue Weise, die zuvor unmöglich war
- Spare Zeit und Mühe durch automatisierte Berichterstellung in 14 verschiedenen Formaten, so dass du dich auf das Wesentliche konzentrieren kannst: Das Wachstum deines Unternehmens.
AnalyticsGate Features
Automatische Datenaufbereitung
AnalyticsGate kann große und unübersichtliche Datenmengen automatisch aufbereiten und in übersichtliche Tabellen umwandeln.
Dashboards
Mit dem Add-In können Sie schnell und einfach ansprechende Dashboards erstellen, die es ermöglichen, wichtige Daten auf einen Blick zu erfassen.
Data Blending
AnalyticsGate ermöglicht es, Daten aus verschiedenen Quellen zusammenzuführen und zu analysieren, um ein umfassenderes Verständnis der Daten zu erlangen.
Automatische Datenaufbereitung
AnalyticsGate kann große und unübersichtliche Datenmengen automatisch aufbereiten und in übersichtliche Tabellen umwandeln.
Datenvisualisierung
AnalyticsGate stellt die Daten in anschaulichen Diagrammen und Grafiken dar, die leicht zu interpretieren sind.
Excel-Integration
AnalyticsGate ist als Add-In in Excel integriert und erweitert somit die Funktionalität des Programms um leistungsstarke Analysefunktionen.
Wir haben Ihr Interesse geweckt?
AnalyticsGate - Wissensdatenbank
Was ist AnalyticsGate?
AnalyticsGate (früher bekannt als Sense Excel) ist ein Add-In für Microsoft Excel, das es ermöglicht, komplexe Datenanalyseaufgaben automatisch durchzuführen und die Ergebnisse in übersichtlichen Tabellen, Diagrammen und Grafiken darzustellen.
Es bietet eine Vielzahl von fortgeschrittenen Analysefunktionen, die über das Standardangebot von Excel hinausgehen, und ermöglicht es Anwendern, Daten besser zu interpretieren und Entscheidungen zu treffen.
Mit AnalyticsGate können Sie Zeit und Ressourcen sparen, indem es die Möglichkeit bietet, Daten aus verschiedenen Quellen zusammenzuführen und Prozesse zu automatisieren. Es ist einfach zu bedienen und erfordert keine Vorkenntnisse in Programmierung oder statistischen Methoden.
Warum ist AnalyticsGate die Lösung für Ihre Liquiditätssteuerung
Qlik Sense ermöglicht eine komfortable Evaluierung und Überwachung zentraler Kennzahlen wie des Cash-Flows.
Doch für die Simulation von Cash-Flow-Szenarien bei veränderten Parametern bedarf es AnalyticsGate, unseres intelligenten Qlik Sense Add-ons.
Dank der nahtlosen Integration von Excel in Qlik Sense können Daten über die vertraute Exceloberfläche eingegeben und direkt für Analyse und Reporting in Qlik genutzt werden. Dies eröffnet Einblicke in die Zukunft und vereinfacht die Liquiditätsplanung und -steuerung erheblich.
Advanced Analytics
Kostenlose Tutorials & Video-Anleitungen auf unserem YouTube-Channel
Advanced Analytics
Regelmäßige kostenlose Webinare rund um Anwendungen zu AnalyticsGate


